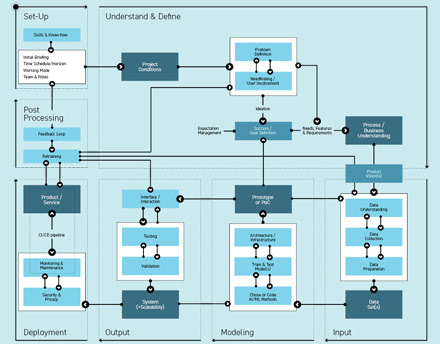
1. Data Insights & Understanding
Activities related to data understanding are the evaluation of the data at hand and which data is relevant to the problem and business domains. Clarify potential data sources, including data that is not easily accessible to an AI/ML algorithm, such as input from human to human conversations not necessarily being reproduced on a database and slicing data into the different iteration cycles, starting small, scaling later. The use of data visualization tools is helpful for understanding the data better, it is also helpful when communicating findings and questions to business domain experts.
Activities related to data understanding are the evaluation of the data at hand and which data is relevant to the problem and business domains. Clarify potential data sources, including data that is not easily accessible to an AI/ML algorithm, such as input from human to human conversations not necessarily being reproduced on a database and slicing data into the different iteration cycles, starting small, scaling later. The use of data visualization tools is helpful for understanding the data better, it is also helpful when communicating findings and questions to business domain experts.
+ Data Sample Selection & Definition: Making sure that the initial data sample represents a variety of different cases.
+ Different Data Sources: Clarifying potential sources such as databases, data lakes, and types of data, domain specific, statistical, qualitative data points from human to human interaction. The (11) Data Landscape Canvas can support this activity. + Data Strategy: Establishing rules for access rights and data privacy settings, including new data points.
+ Data Visualization: Creating visual representations of the data (line charts, box plots, etc.) as early as possible, using tools such as Tableau, Qlik Sense.
2. Data Collection
If the data needed is not already available, or additional data is needed, collecting (additional) data is necessary.
If the data needed is not already available, or additional data is needed, collecting (additional) data is necessary.
+ Existing vs. collecting: Clarifying if an existing data set that suits the project needs is available. This can either be open source or behind a paywall. If existing databases are not an option, collecting data is possible. Depending on the AI/ML method the amount of data points is important. Therefore collecting data might take a lot of time and effort.
+ Bias: Checking for bias in the data. (12) What if tool can assist this activity.
+ Ethics: There is a lot of ongoing debate and discourse about the ethics of AI/ML solutions. It is its very own research area. It is divided between philosophers, psychologists and the technology domain, a very delicate field and unknown, but nevertheless important field for designers. Ethical issues in AI/ML can be related to data privacy concerns, as well as discrimination against certain groups (related to bias in data), amongst others. There are some materials out there that designers and data scientists can use to handle that issue, such as (13) IDEO ethics card deck, (14) obi data ethics canvas. No final code of ethics for AI exists yet.
+ Quantitative & Qualitative: Statistical data sets such as financial data (e.g. price development), telemetry data (e.g. GPS tracking), sensor data (e.g. runtime, downtime) are not implying reasons why certain data insights and correlations are discovered from data. It can be a value addition to mix quantitative data with additional information from qualitative data to detect correlations and improve data insights and data evaluation. It is also necessary and helpful to find out if all the data is available in the database that the AI/ML solution has access to. Sometimes relevant data and information is exchanged verbally between humans, knowledge about certain issues which the AI/ML algorithm cannot react to. This might lead to wrong expectations of model performance.
3. Data Preparation
Once data is understood and collected, the related data set needs to be prepared for the model’s training.
Once data is understood and collected, the related data set needs to be prepared for the model’s training.
+ Different data types: Classifying the different data types. This activity helps to choose the AI/ML method. Generally, in ML there are two different types of data, structured and unstructured data. Sensor data, weblog data, financial data, weather data and ‘point-of-sale’, as well as click-stream data are related to structured data. This type of data is typically stored in relational databases and has a defined length and format. Text, images, voice, videos, radar or sonar data are related to unstructured data. This type of data has some implicit structure, but it does not follow a specific format. Cloud, mobile devices and social media are typical data sources.
+ Data labeling: In certain cases, labeled data is necessary (supervised learning); if the data is too domain specific, setting up a data labeling pipeline is necessary, meaning the domain experts have to take care of this activity.
+ Verify quality: For data quality, a couple of factors are relevant, such as the number and amount of data points, their consistency and available history. In most cases, more data is better than little data. + Clean: Cleaning data, standardizing data formats such as dates, getting rid of duplicates, outliers, negative numbers, etc. is necessary. There are a couple of tools out there to support this process, such as e.g. KNIME, or easydatatransform.
+ Feature extraction/generation: The concept of feature extraction is taking an initial set of data and transforming it into a reduced set of features (feature vectors). This step is necessary when a data set is too large to be processed by an algorithm and most of the data points are perceived to be redundant (e.g. repetitive, containing the same measurements in different units). For designers working closely with data scientists or having expertise in statistical techniques (15) dimensionality reduction is a commonly used method.
Steps 1 to 3 heavily depend on and influence each other. Sometimes the borders are blurred and activities cannot be separated as stated. However, it is crucial to understand that AI/ML algorithms heavily depend on the input data and that this module is therefore very important overall. Designers can contribute with their human-centered perspective and data visualization skills, but it is also important to understand statistical data sets and be familiar with data preparation activities. The level of knowledge on the designer’s side is vital for the involvement of their expertise in this module. Here the data scientist and ML engineers also work closely together to make sure that data and AI/ML method are aligned.
Outcome: Data Set(s)
This module occupies a lot of time and resources, more than 50% of AI/ML projects are data work. The better process knowledge, business domain and product vision are defined and understood, the easier it is to focus on the data necessary to answer the challenges. If something is not clear with the data at the end of this module, it is necessary to start over again.

